
The ONS has revised September's Hertsmere count from 2,450 to 2,415, a small fall on August. Cowley Hill's 5.5% rate is still the highest of 16 wards.
Updated 17 November: the ONS has revised the September 2026 count down from 2,450 to 2,415 in its release of 17 November, so September was a small fall on August rather than a third monthly rise. October rose to 2,475. Our October report has the new figures. See the note at the foot of this article.
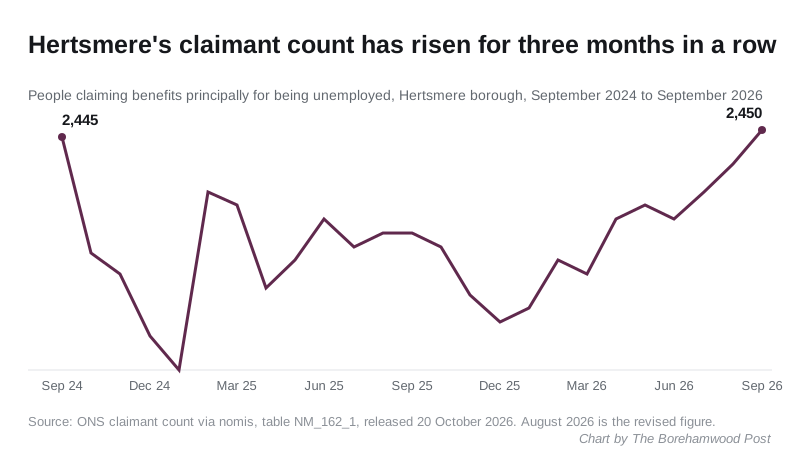
2,450 people in Hertsmere were claiming benefits principally for being unemployed in September 2026. That is 25 more than in August and 75 more than a year earlier.
It is the third monthly rise in a row. It is also the highest count in the borough since August 2024, when it reached 2,465.
The Office for National Statistics published the figures on 20 October. They cover the whole borough: Borehamwood, Bushey, Potters Bar, Radlett and the villages.
August was lower than first published
Last month we reported an August count of 2,465. The ONS has since revised it down to 2,425.
That is normal for this series. The ONS says the Universal Credit part of the count “allows for revisions to the data for one previous month”, and we flagged at the time that August could move. It moved by 40, which is large for a borough this size.
The revision changes the shape of the story. August was not a joint high after all. Instead the count has climbed steadily, month by month, since the spring:
- March 2026: 2,345
- April 2026: 2,385
- May 2026: 2,395
- June 2026: 2,385
- July 2026: 2,405
- August 2026: 2,425 (revised)
- September 2026: 2,450
That is 105 more claimants in six months. September’s figure may itself be revised when the October data comes out in November.
What the number is, and is not
This is not the unemployment rate. The ONS says the claimant count “does not attempt to measure unemployment”. It counts people claiming benefits principally because they are unemployed.
Since Universal Credit, that includes some people who are in work on low pay and still required to look for more. A rise can mean more people out of work, more people in insecure jobs, or both.
Borehamwood holds almost half the claimants
For the first time we can show where in the borough the claimants live. The ONS publishes the count for each of Hertsmere’s 16 wards.
Borehamwood’s four wards account for 1,135 of the 2,450, about 46 per cent:
| Ward | Claimants | Share of 16 to 64s |
|---|---|---|
| Borehamwood Cowley Hill | 360 | 5.5% |
| Borehamwood Brookmeadow | 280 | 4.8% |
| Borehamwood Kenilworth | 275 | 4.3% |
| Borehamwood Hillside | 220 | 4.0% |
Cowley Hill has the highest rate in the borough, at 5.5 per cent. That is higher than Watford’s 4.6 per cent, the highest of any Hertfordshire district.
Potters Bar Oakmere is second, at 5.0 per cent, with 180 claimants. At the other end, Aldenham East has 45 claimants and a rate of 1.5 per cent, the lowest in the borough.
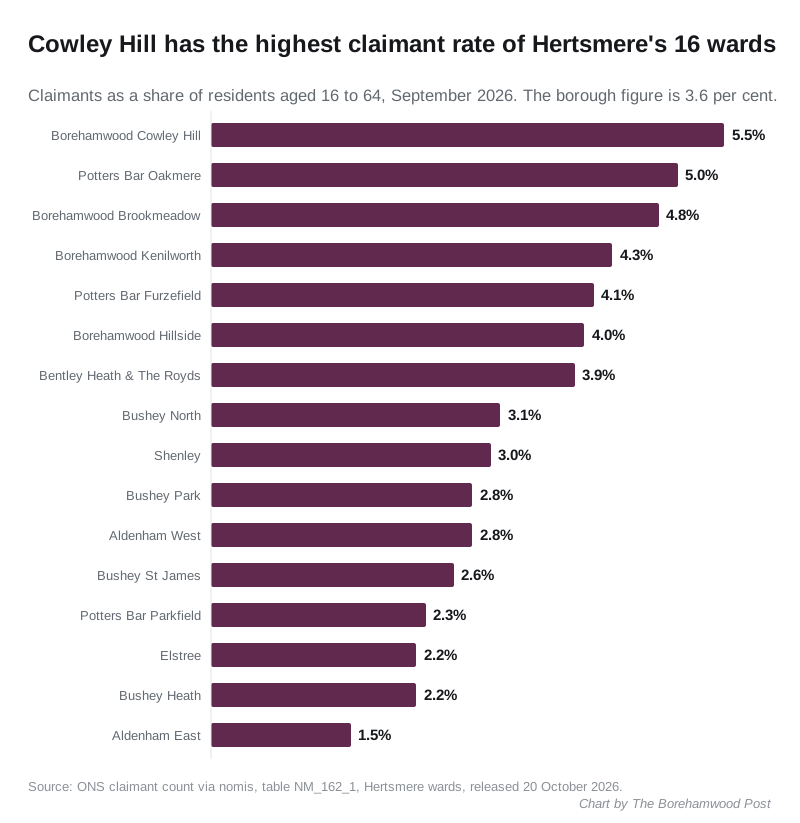
The ward figures are rounded to the nearest five. They add up to 2,445, five short of the borough total, for that reason. The wards were redrawn in 2024, so there is no like-for-like ward figure from a year ago.
Who is claiming
Compared with September 2025, the rise is spread across the age groups:
| Age group | September 2025 | September 2026 | Change |
|---|---|---|---|
| 16 to 24 | 360 | 390 | up 30 |
| 25 to 49 | 1,400 | 1,435 | up 35 |
| 50 and over | 615 | 630 | up 15 |
Young people are about one claimant in six. Their number has risen by about 8 per cent in a year, faster than the other two groups.
Second highest in Hertfordshire
As a share of residents aged 16 to 64, Hertsmere’s rate is 3.6 per cent, unchanged on August. The Hertfordshire figure is 3.0 per cent and the United Kingdom’s is 3.9 per cent, up from 3.8.
Watford, on 4.6 per cent, is the only Hertfordshire district with a higher rate. Stevenage, level with Hertsmere last month, is now on 3.5 per cent. East Hertfordshire is lowest, on 2.0 per cent.
What it means for you
If you are out of work or on low earnings, the routes are the same wherever you live in the borough:
- Jobcentre Plus and Universal Credit are run by the Department for Work and Pensions, not by Hertsmere Borough Council.
- Council tax support is a Hertsmere scheme, and a drop in income can change what you owe. Our council tax bands page sets out what each band costs before any discount.
- Housing and homelessness advice also sits with the borough council.
For everyone else, the ward table is the part worth keeping. The council is spending developer money on community buildings in some of these wards, including £3.5 million on rebuilding Aycliffe Pavilion. The claimant count is one of the few measures published every month that shows whether things in those wards are getting better.
Revision note, 17 November 2026
This article reported the figures as first published on 20 October. On 17 November the ONS revised the September 2026 count for Hertsmere from 2,450 to 2,415, under the one-month revisions policy described above. On the revised figure, September was 10 fewer than August and 40 more than September 2025, and it was not the highest count since August 2024. Some ward figures moved too: Brookmeadow is now 270, Kenilworth 270 and Potters Bar Oakmere 175 for September. The text above is left as first published so the change is visible. The current figures are in our October 2026 report.
Sources
- ONS claimant count for Hertsmere, table NM_162_1 via nomis, the 25-month count series, including the revised August figure.
- The same table by age group, September 2025 and September 2026.
- Claimant count and rate for Hertsmere’s 16 wards, September 2026 (use measure=1 for the counts).
- Rates for the ten Hertfordshire districts, and for Hertfordshire and the United Kingdom.
- nomis dataset overview for NM_162_1, which records the data as last updated at 07:00 on 20 October 2026.
- ONS, Claimant Count Quality and Methodology Information, for the definition and the revisions policy.
Related
- Hertsmere claimant count, August 2026: last month’s report, now carrying the revised figure.
- Aycliffe Pavilion: £3.5m earmarked, levy bidding shut: the council’s community infrastructure spending.
- Borehamwood council tax bands: what each band costs, and where support is handled.
Have your say