
The average Hertsmere home rose 1.1% in September to £554,810. Over a year it is up 2.9%, third fastest in Hertfordshire, but still £31,123 below the 2022 record.
The average home in Hertsmere sold for £554,810 in September 2026. That is £5,960 more than in August, a rise of 1.1% in a single month.
HM Land Registry published the figures on Wednesday 18 November, in its UK House Price Index for September 2026.
Over a full year the borough is up 2.9%, or £15,764 on September 2025. Only St Albans and Welwyn Hatfield rose faster in Hertfordshire. Across England prices rose 0.8% over the year and fell 0.4% in the month.
Overview
- Average Hertsmere price, September 2026: £554,810, the official UK House Price Index figure for the whole borough.
- Change in a month: up £5,960, or 1.1%, on August’s £548,850.
- Change in a year: up 2.9%, against 1.6% for Hertfordshire and 0.8% for England.
- Record: still £31,123 (5.3%) below the borough’s peak of £585,933 in October 2022.
- First-time buyers: paid an average of £412,939, up 2.6% in a year.
A better month after a weak summer
The Hertsmere average fell sharply in July and barely moved in August. September recovered most of July’s fall.
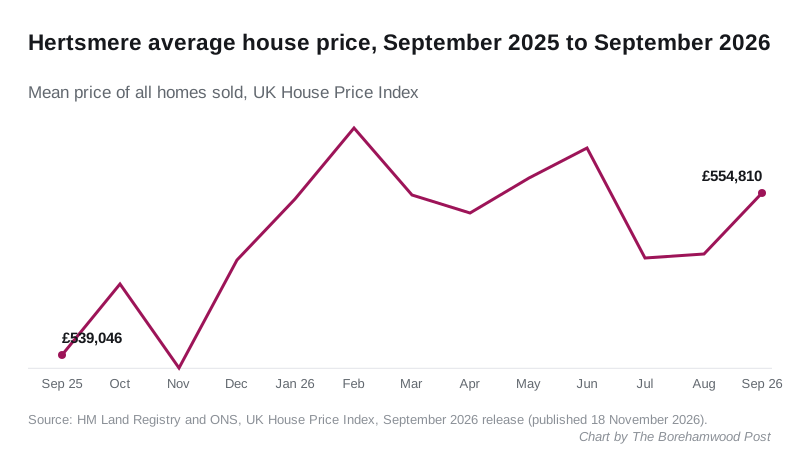
| Month | Average price |
|---|---|
| September 2025 | £539,046 |
| October 2025 | £545,959 |
| November 2025 | £537,804 |
| December 2025 | £548,255 |
| January 2026 | £554,200 |
| February 2026 | £561,046 |
| March 2026 | £554,594 |
| April 2026 | £552,870 |
| May 2026 | £556,224 |
| June 2026 | £559,139 |
| July 2026 | £548,451 |
| August 2026 | £548,850 |
| September 2026 | £554,810 |
The highest month of the past year was February, at £561,046. September sits £6,236 below that.
Earlier months move as late sales are registered. July was first published at £548,704 and now stands at £548,451, a change of £253.
Semis and detached homes led the rise
Every type of home in Hertsmere is worth more than a year ago. Flats rose least.
| Type | September 2026 | Change in a year |
|---|---|---|
| Detached | £1,208,047 | +3.9% |
| Semi-detached | £623,357 | +4.1% |
| Terraced | £492,548 | +3.4% |
| Flat or maisonette | £294,735 | +0.7% |
| All homes | £554,810 | +2.9% |
First-time buyers paid an average of £412,939, up 2.6% in a year. Buyers who have owned a home before paid £699,662, up 3.3%.
Buyers with a mortgage paid an average of £558,651. Cash buyers paid £543,720.
How Hertsmere compares with the rest of Hertfordshire
Hertsmere remains the third most expensive district in the county, behind St Albans and Three Rivers. St Albans set a new record in September.
| District | September 2026 | Change in a year | Gap to record |
|---|---|---|---|
| St Albans | £666,824 | +5.7% | At its record |
| Three Rivers | £594,731 | +1.4% | -3.1% |
| Hertsmere | £554,810 | +2.9% | -5.3% |
| Dacorum | £456,728 | +0.3% | -2.2% |
| East Hertfordshire | £455,649 | +1.3% | -0.8% |
| Welwyn Hatfield | £453,952 | +3.3% | -1.9% |
| North Hertfordshire | £426,862 | +2.2% | -0.1% |
| Broxbourne | £410,960 | +0.4% | -2.0% |
| Watford | £400,817 | -1.6% | -5.1% |
| Stevenage | £304,493 | -2.4% | -9.1% |
In July Hertsmere sat further below its own record than any other district in the county. After September’s rise it is second furthest, behind Stevenage.
Across the border, the London Borough of Barnet averaged £592,919, down 3.2% in a year. Hertsmere’s 2.9% annual rise ranks 65th of England’s 295 local authority districts.
What it means for you
- If you are selling, the borough average has climbed back towards its February high, but it is still well short of the 2022 peak. A valuation pitched at 2022 prices is likely to be ambitious.
- If you are buying your first home, the first-time buyer average of £412,939 is the figure to plan around, not the headline £554,810.
- If you own a flat, values have barely moved in a year, up 0.7%, while houses rose by 3.4% to 4.1%.
These are averages for the whole borough, which mixes Borehamwood with Radlett, Bushey and Potters Bar. Our Borehamwood house prices page breaks sold prices down town by town.
About these figures
The UK House Price Index is a mean average, not a median, adjusted for the mix of homes sold. A handful of very expensive sales can lift it, and the latest months are revised as more sales are registered. The figures come from the ONS and HM Land Registry local house price data for Hertsmere and the September 2026 index files.
Sources
- HM Land Registry, UK House Price Index full file for September 2026, published 18 November 2026, for every average, monthly and annual change, property type, buyer type, record month and district ranking in this report.
- UK House Price Index reports and methodology, for the note that the average is a mean and that recent months are revised.
Have your say